Statistics has suddenly become one of the most sought-after specializations with the emergence of data science as the best job of the 21st century. It’s not that statistics was not important earlier, but today it has reached altogether a new level. In this article, we will talk about the basics of statistics.
Generally, there are types of descriptive statistics. 1. Descriptive statistics and 2. Inferential statistics. And it is very important, for those who want to make a career in the field of data science or data analytics, to know the difference pretty well.

Descriptive Statistics
Descriptive statistics is the type of statistics which is used to summarize and describe the dataset. It is used to describe the characteristics of data. Descriptive statistics are generally used to determine if the sample is normally distributed. It is displayed through tables, charts, frequency distributions and is generally reported as a measure of central tendency.
Descriptive statistics include the following details about the data
- Central Tendency
- Mean – also known as the average
- Median – the centermost value of the given dataset
- Mode – The value which appears most frequently in the given dataset
Depending on what exactly you’re trying to describe, you will use a different measure of central tendency. Mean and median can only be used for numerical data. The mode can be used with numerical and nominal data both.
- Statistical Dispersion
- Range – Range gives us the understanding of how spread out the given data is
- Variance – It gives us the understanding of how the far the measurements are from the mean.
- Standard deviation – Square root of the variance is standard deviation, also the measurement of how far the data deviate from the mean
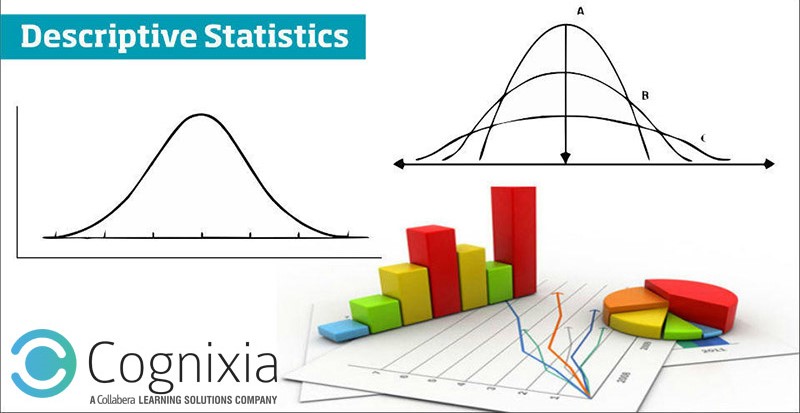
- The Bell Curve – It is a graph of a normal distribution of a variable, it is called a bell curve because of its shape.
- Skewness – It is the measure of the asymmetry of a distribution of a variable about its mean
- Kurtosis – It is the measure of the “tailedness” of a distribution of a variable. It gives us the understanding of how closely the data is spread out.
Descriptive statistics is extremely useful in examining the given data. We can get the complete understanding of the data with the use of descriptive statistics. In the next article, we will talk about inferential statistics.

